
Wow – three quarters of the way through the year and there is still a full three months to go. I don’t know about the rest of you, but I am about ready to pull the pin on 2019 and start 2020 right away, if only to get away from this gad-awful Canadian election and the ongoing Trump-impeachment circus.
And as we all know, quarter end is when I look back at my Fearless (Foolish?) Forecast and grade myself on the various qualitative and quantitative calls I made. I haven’t yet looked at my results, but I’m pretty sure they are not going to be anything bragworthy. It has been that much of a disaster of a year.
If you’ve been following the energy market at all or have spent anytime in the real world instead of playing Fortnite, you know that my stock picks have all been taken out behind the wood shed, but that shouldn’t surprise anyone, the last few years have been underperformance defined.
While I do think I am hitting it out of the park on some of my broad themes of unrest and chaos, I think we can all agree that in a world dominated by the likes of Donald Trump and Boris Johnson, this is kind of like taking a candy from a baby.
But as always, let’s look at the results before we pass judgement. In fact, I will look at the results and pass judgement myself, and trust me, I won’t go easy on me. Or something like that.
And before I start – yes, I know. How can someone in industry be so wrong about commodity prices and why are the stock picks so bad?
Broad Themes
The forecast for this year started with civil unrest, particularly in the Middle East, which, now that I think about it a bit was a giant cop out. After all, what could be easier than predicting unrest in Iran, Iraq, Israel, Palestine, Yemen and other places, especially with US sanctions biting in Iran, Syria doing that Syria thing, ISIS being defeated, Turkey and Russian meddling. The usual. So a bit of a cop out of a forecast even though it is pretty much spot on every year. In fact it is the easiest forecast one can make in geopolitics. And of course it does playout as it is supposed to month after month, year after year.
Although to be truthful, I was not expecting to see the elevated levels of confrontation between Iran and the United States, nor could anyone have realistically predicted the attacks on the Abqaiq processing facility and Khurais production centre in the Saudi Arabia. As an aside – isn’t it great that we can use and unmanned drones now? That’s putting those video game skills to great use. While the Saudis quickly restored production and soothed an oil market that is far too sanguine about looming supply pinchpoints, the prospect for further Middle East conflict continues to rise. Although, truth be told, if I’m Iran, I’m now playing it cool as there is nothing Trump would like more than an opportunity to venture out against Iran to distract from his domestic disaster.
And now we have protests in Iraq, where people want good government (go figure) and those protests threaten to disrupt the energy economy there, which of course will be a great test of how much throughput and spare capacity the Saudis have actually restored, or is it all just some and mirrors to protect an IPO that may likely never happen. Just saying…
And, not to be outdone we have the protests in Hong Kong, which while not predicted specifically by me, I will nonetheless assume full credit for, because, well, I can. So there.
The other theme I discussed was an unfolding global economic slowdown and the rising recession risk in North America and Europe as well as a trade and debt induced economic shock in China. If the inverted yield curves weren’t enough of a flashing red light for policy makers in the United States, the recent spate of disastrous PMI indices and Manufacturing data should be. Industrial production, employment and trade numbers indicate underlying weakness and are trending downward, supported only by lingering strength in services. The combination of massive corporate and government debt and persistent deficits, unnecessary and unproductive trade wars and the flashing red warning signals the stock market is giving should make everyone sit up and take notice. Recession risk in the United States is rising and Canada is not immune. Notwithstanding all the self-promoting bravado, the fact that Donald Trump keeps harping on the Fed to lower rates suggests to me a certain level of, what’s the word… Panic.
Another prediction I made was that the Donald Trump trade war would come to an end so that the world can recover some semblance of an even keel. Is it happening? Not really. True to Trumpform, there are a lot of announcements and very little in the way of progress. Mexico and Canada steel tariffs have come and gone, the border tariff threat was empty, and the Chinese escalation appears to be currently in limbo. A recent WTO ruling has allowed the US to slap tariffs on a whole host of EU imports including Swiss cheese (not in the EU) and Irish Whiskey, while exempting Chanel handbags – all in retaliation for Airbus subsidies that are rivalled only by Boeing subsidies. The USMCA (Nafta 2.0) is hung up and not likely to pass while the political crisis unfolds. So. Lots of uncertainty. As I said in my forecast, I have zero confidence in the ability of anyone involved to extricate us from this madness so, as I said, buckle up.
The next part of the qualitative forecast is harder to assess. I suggested that 2019 was going to be hard for the Donald and clearly this is the case. He has lost the House and can no longer govern via executive order with impunity. Nancy Pelosi is a more than capable check on the Trump and the Democrats have the GOP on the run in many areas. With the economy slowing and no one believing in the border wall emergency it would seem the deck is stacked. While the Mueller report mostly fizzled, largely due to its complexity, the current impeachment inquiry emanating from the Ukrainian ShakedownTM whistleblower complaint is sending Trump off the deep end as he and his bizarre cast of thugs, ne’er do wells and outright lunatics (hello Rudy!) continue to feed the fire for no discernible reason. One has to wonder at Trump’s completely bizarre obsession with Joe and Hunter Biden – doe he really fear him that much? Joe’s a formidable political rival, but he’s not even close to securing a nomination, and even if you do discredit him Don, careful what you ask for because next in line Elizabeth Warren is an emerging political assassin.
That said, if he makes it through 2019, re-election odds rise significantly. But right now, the odds are not forever in his favour and the GOP may indeed soon offer him up as tribute.
On the energy front, my predictions really centered around the lack of exploration being initiated outside of the Permian and the day of reckoning that is coming. With OPEC+ finally taking the supply side seriously and Saudi Arabia determined to lower inventories, that lack of investment should come home to roost later in the year. Let’s all hope OPEC has some spare capacity when it is called on in Q4.
Thematic Grade? B. Directionally OK, but still a work in progress.
Production
Our prediction on production is of course area dependent but as always starts with the madness that is the Permian, West Texas and the rest of shale-mania. Our forecast was increased production in the United States of up to 800,000 bpd, closing the year at 12.5 mm bpd.
I think we can still get there, but after a strong start, the year has been mixed. Active rigs are off in the United States YTD by more than 160 as operators focused on reducing the number of DUCs which according the EIA number in excess of 6500 for oil and 8000 including natural gas basins. This enormous amount of DUCs explains production growth in the face of a declining rig count, but the lag in production from reduced drilling is 4-6 months so we should start seeing the slowdown during Q4. It is estimated that the US needs to drill and complete in excess of 5000 wells a year to offset declines, so the DUC inventory isn’t maybe as robust as it seems – add in child well issues, gas oil ratios and decling initial production rates and the challenges to maintaining this elevated level of production become apparent.
Based on weekly numbers, US production closed the quarter at 12.4 million bpd, basically the year’s predicted growth but expect that number to stagnate for a while. Not to mention monthly data that continually revises these numbers down.
US Production Grade – B. A decent start, but as producers churn through their DUC inventory, the forecast may fall short.
In Canada, notwithstanding current curtailment policy, we predicted modest growth in production – on par with last year, probably in the order of 250,000 to 300,000 bpd of oil. This will come from both oilsands, the conventional world and condensate. And it’s going to come in the second half of the year. That said, this prediction was predicated on both crude by rail and Line 3 seeing significant advancement and right now that isn’t happening.
Canada Production Grade – Incomplete – heading for a fail, thanks for nothing Minnesota, slow-footed Kenney government on the crude by rail front and pretty much anyone I see on the street.
An aside about curtailment. Our prediction was that the curtailment job is done, time to get out of the way and let the market finish the job. Given pipeline developments, this appears premature.
Curtailment Grade – Incomplete
OPEC production levels were predicted to be flat year over year depending on what happens with the new OPEC/NOPEC agreement at the various jump-off points through the year. The key to the agreement is the Saudi/Russia collaboration continuing. We now know that even when they aren’t being targeted by Iran that the Saudis are producing well below their quota in a bid to rapidly restore balance and the agreement doesn’t expire until March.
Grade – A
Price of oil
As always the glory call. And this year I went as bullish as bullish can be because I believed the bullish case would win the year which is still possible if Iran decides to play ball (nod, nod, wink, wink, say no more).
While I still believe the bullish case for oil wins in the long run – it ain’t happening this year as far as I can tell – fortune favours the bold, except in commodities. On the plus side, I predicted oil prices to be pretty volatile during the year, so there’s that. My year end price is $80.03 but my average price for the year is going to be $61.47. At the end of Q3, the price of oil was $54.07 and the average was $57.12. I think I may hit the average, but probably need a shooting war in Iran to hit my year end.
Grade C – still another quarter to go, anything can happen – right?
Price of Natural Gas
Ah natural gas, I can’t quit you! Super cold winter, massive consumption, LNG and we still can barely catch half a break on pricing. Notwithstanding another massively bullish call, it’s going to be a long year.
My year end price forecast for natural gas was $3.90 with an average price of $3.26, up marginally from last year. Fingers crossed. At the end of Q3, the price was $2.37 and the average was $2.62.
I. Give. Up.
Grade D.
Activity Levels
On the Canadian side, this year was posited as a hard one to predict given the curtailment policy of the Alberta government, egress issues and all that. The basic prediction was an unmitigated disaster for Q1, self-correcting through the first half with a rally of sorts in the second half of the year.
So far I’m almost on track if you replace the words “rally of sorts” with “regional pockets of modest activity”.
The rig count continues to lag last year’s levels and to be completely honest, isn’t going to change much until curtailment is dead and buried.
Our forecast was flat with last year and of course we must stick with it. But absent a Q4 rally that is pretty much never going to happen, it’s just a crappy year.
Grade D – Not looking good so far
Unlike Canada, the US had significant growth last year in both rig count and production. That said, the rig count has fallen considerably since the end of Q2. While the Permian drilling frenzy continues, albeit at a more managed pace, US activity is definitely off across the board.
The longer we sit at a range bound price for oil in the mid to high $50’s the more discipline will be imposed on LTO players, further suppressing activity.
While good for Canada in the long run, this really doesn’t help my forecast.
I noted last quarter that in the Schlumberger year end call, they estimated that soon 75% of all US drilling will be just to maintain production levels. And since pretty much everyone is publicly traded and needs to show at the least maintenance of production, US activity must absolutely continue. So I guess that gives us a baseline for drilling activity. Note that while you think that would be the case for Canada too, it is important to note that 75% of our production is from the oilsands which have a 3% annual decline as opposed to 35% or more in LTO.
Grade – C – Incomplete.
M&A Activity
We predicted that M&A activity in Canada would pick up as the curtailment issues settled out and infrastructure got more certainty. M&A in the US was expected to pick up as well as assets changed hands and companies consolidated acreage. And we are sticking to that Canada forecast. For Q4. So far this year we have seen a few interesting deals. Devon sold to serial aggregator CNRL at a significant discount. Pieradae stole some gas assets from Shell. And in the US, Anadarko was subject to a bidding war between Chevron and Occidental which Oxy “won” for an absurd valuation. Go figure.
In Q3, the US recorded the highest volume of upstream M&A since 2009, highlighted by BP buying BHP assets in the Permian, the Eagle Ford, and the Haynesville basins for US$10.5 billion—the biggest acquisition for BP since buying Arco in 1999. Another big deal was Diamondback Energy buying Energen for US$9.2 billion, creating the third-largest pure play Permian producer. Expect the shale consolidation to continue as in excess of $30 billon in assets remain on the block.
The only Canadian deal of scale was Crescent Point selling its Uinta assets in September $900 million.
In the services sector we expect to see activity pick up through the end of the year, certainly on the private company side, focused strongly on infrastructure and production maintenance.
LNG construction is under way and it is hard to ignore as an opportunity. Money will follow.
Just not yet.
And it does bear repeating to all my American readers – Canada is a currency advantaged, rational valuation and stable market for consolidators tired of the madness in Texas. BUY, BUY, BUY. Oh, did I mention… BUY?
Grade C – Incomplete
Canadian Dollar
We said the Canadian dollar should see some relative stability this year with the commodity price, but a slumping economy is going to counterbalance that. We are currently at $0.76 and I predicted $0.78. We need an actually growing energy sector to get there or a deliberately tanked US $ from el Trumperton, so the fingers are crossed.
Grade B
Infrastructure
I know on the surface things look bleak, but it may surprise people outside of the energy sector that we are on the cusp of an infrastructure supercycle in Canada and I still believe that. This should continue well into the 2020s. Out on a limb and don’t fit me for a straight jacket, but I fully expected to see the following in 2019:
- Line 3 complete and operational by year end (missed that, curse you Minnesota)
- TransMountain Expansion underway in the summer (good call, depends on your definition of both “underway” and “summer”)
- Keystone XL back in play later this year (things are looking up on the KXL front with US government approvals, but TC Energy needed to get building this summer)
- Coastal Gas Link fully underway this summer (yup)
And we may get one more LNG FID this year. So there.
Grade B
Stock Picks
Since last year was such a disaster, I decided to pick some names I was more familiar with and also a few… outliers. Still not sure of the wisdom of this, but it was worth a shot.
True to my rules, this year I picked two Canadian E&P’s as well as two service companies and, finally, one American producer and one American service company. As a reminder, the companies were as follows:
- Suncor. A core holding if you want to play Canada.
- Crescent Point. The down-trodden once golden child trying to reinvent itself.
- CES Energy Solutions. CES provides chemical solutions and services through the lifecycle of the oilfield ranging from upstream through pipelines and downstream.
- CWC Energy Services. Small cap service and I know the CEO and he’s a pretty smart guy.
- Talos Energy. A pure-play Gulf of Mexico producer with current production of 55,000 boe.
- Tetra-Tech. Consulting and engineering in the areas of water, environment and infrastructure.
Here goes nothing…
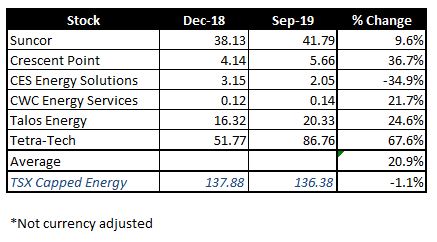
Wow – nowhere near the train-wreck I thought it was going to be.
Grade B!
Overall?
I give it a solid B-. Thoughts?
Prices as at October 4, 2019
- Oil prices are down, down, down
- Storage posted an increase week over week
- Production fell
- Rig Counts: Alberta +11; US down week over week
- Natural gas storage down relative to 5-year avg, but remains higher than this point last year
- WTI Crude: $52.91 ($55.83)
- Western Canada Select: $39.46 ($42.98)
- AECO Spot: $1.373 ($0.8988)
- NYMEX Gas: 2.337 ($2.388)
- US/Canadian Dollar: $0.7509 ($0.7549)
Highlights
- As at September 27, 2019, US crude oil supplies were at 422.6 million barrels, an increase of 3.1 million barrels from the previous week and 18.7 million barrels above last year.
- The number of days oil supply in storage is 25.3 compared to 23.6 last year at this time.
- Production fell 0.1 million barrels for the week at 12.400 million barrels per day. Production last year at the same time was 11.100 million barrels per day.
- Imports fell to 6.291 million barrels from 6.378 million barrels per day compared to 7.965 million barrels per day last year.
- Exports from the US fell to 2.867 million barrels per day from 3.983 million barrels per day last week compared to 1.723 million barrels per day a year ago
- Canadian exports to the US were 3.386 million barrels a day
- Refinery inputs fell during the during the week to 16.017 million barrels per day
- As at September 27, 2019, US natural gas in storage was 3.3.17 billion cubic feet (Bcf), which is about 1% lower than the 5-year average and about 16% higher than last year’s level, following an implied net injection of 102 Bcf during the report week
- Overall U.S. natural gas consumption was flat during the report week.
- Production grew 1% for the week. Imports from Canada rose by 6% from the week before. Exports to Mexico increased 6% for the week
- LNG exports totaled 40 Bcf
- As of October 4, 2019, the Canadian rig count was up 17 at 144 (AB – 94; BC – 10; SK – 36; MB – 3; Other – 1). Rig count for the same period last year was 213.
- US Onshore Oil rig count at October 4, 2019 is at 710, down 3 from the week prior.
- Peak rig count was October 10, 2014 at 1,609
- Natural gas rigs drilling in the United States was down 2 at 144.
- Peak rig count before the downturn was November 11, 2014 at 356 (note the actual peak gas rig count was 1,606 on August 29, 2008)
- Offshore rig count was flat at 24.
- Offshore peak rig count at January 1, 2015 was 55
US split of Oil vs Gas rigs is 83%/17%, in Canada the split is 69%/31%
Trump Watch: Is there anyone who isn’t going to investigate Biden?
Kenney Watch (new!): Not a war room. An information room
Trudeau Watch (for balance): Two planes with carbon offsets, bought from Gerry’s friend’s company